Data analysis
Teachers can analyse data in order to improve their performance.
Why data?
Data has become a critical driver of decision-making.
"Without data, you're just another person with an opinion"
W. Edwards Deming
Analytics for teachers
Collecting and analysing data supports teacher inquiry. You can gather and analyse data to identify at-risk students, inform your inquiry, and quantify the impact your interventions are having on student learning.
Data provides you with:
- a broader overview of students' needs
- the ability to make well-informed decisions
- the ability to measure the effectiveness of strategies and interventions
- greater awareness of where to spend time, effort, and resources in order to maximise impact
- the ability to provide accountability through evidence-based approaches.
Student data is more than just test scores. It comes from a variety of sources to give a fuller picture of student learning. Being able to access shared data via a student management system (SMS) enables teachers to identify areas of need, organise student groupings, and work collaboratively with students and whānau to set learning goals.
Different types of student data
Schools gather a range of student data, including aspects of a student's identity such as:
- demographics – race, age, gender, economic status, special education needs
- academic history – past results, subjects taken.
Although this data may be useful to support a teacher inquiry, it is usually the student data that can change that will be most relevant to teacher inquiry. This includes:
- performance in assessment and achievement data – test results, completion rates
- behavioural data – rewards for positive behaviour, number of incidents, disciplinary actions taken, attendance
- engagement with resources, materials, and tools – how much a particular resource is being used by students, frequency of accessing digital tools and devices for learning and collaboration
- engagement in learning – how many times a student asks a question, answers a question, contributes to the discussion, uses a digital device during the activity/lesson
- student voice – to what extent are students able to articulate their learning goals and express how they are achieving these?
The right data in the right format can inform teacher practice and student learning goals. Privacy and data security must be considered when sharing data with whānau and other schools.
Source: Data Quality Campaign
Visualising and analysing different types of data
Quantitative data
Quantitative data is numerical information, such as:
- days absent from class
- test results
- number of behavioural incidents
- number of times a resource was accessed.
Quantitative data can be easily entered into a spreadsheet and visualised in tables and graphs.
Qualitative data
Qualitative data is descriptive, rather than numerical. It can provide insights into what your students are thinking and feeling about their learning.
Methods for gathering qualitative data include:
"Qualitative data can put flesh on the bones of quantitative data" - Anthony Shaddock
- interviews
- photographs
- video recordings
- reflections
- observations
- open-ended questions in a survey
Qualitative data should be used in conjunction with quantitative data in order to triangulate (validate) your results.
Categorising qualitative data
Coding and categorising qualitative data into numerical data sets makes it easier to visualise and analyse.
Use the insights, revealed by collecting and analysing student feedback data to inform your actions.
Digital tools for analysing and visualising data
There are several tools available for helping you collect, analyse, and visualise data, ranging from professional software to tools designed for casual users.
- Piktochart – A design app for making infographics. It contains tools for visualising data in charts and graphs. It has both free and premium accounts.
- Canva – A graphic design app with an easy-to-use infographic maker.
- Tableau – Software for analysing and visualising data. Free to download and use, and has a premium account for added features.
- NVivo – Software for analysing qualitative data.
More information »
- Commonly used graphs – Different types of graphs and their uses are explained on the Assessment online website.
- The 38 best data visualisation tools – Explanations of, and links to, data visualisation tools in this blog post from Creative Bloq.
Ethics and using data
The technology-rich environment of schools provides easy access to student data. Collecting data to inform teacher inquiry, and classroom teaching and learning is common practice in all schools.
Collecting data can be construed as an invasion of privacy. When collecting, sharing, and reporting on data, ensure you:
- comply with your school's code of practice
- seek approval for your inquiry and methods of data gathering from your team leader
- stay mindful of ethical issues that could arise out of the collection of data, especially if that data is sensitive or likely to provoke strong feelings
- do not share the results with anyone other than the intended group.
Student achievement data
In New Zealand schools, it is important for leaders and teachers to analyse assessment and attendance data in order to gauge student progress, as well as provide accountability to Board of Trustees, and Ministry of Education. While you may use this data to inform an area for inquiry, this is a different purpose for data gathering and analysis. Assessment Online provides information about gathering, analysing, interpreting, and using information about students' progress and achievement in relation to The New Zealand Curriculum.
Key resource
Ten trends 2016: Data-driven organisations
An explanation of why using data is an important focus for education going into the future from CORE Education.
Using data to support teacher inquiry
Technology has expanded our horizons and there is an obvious role for teachers to engage with data to assess what works for them, in their school, with their students.
Using data to improve learning: A practical guide for busy teachers (Shaddock, 2014).
Using data can turn hunches into credible, evidence-based springboards for taking action
As teachers, we all have hunches about what isn't working and what could work better for our students. Timperley, Kaser, and Halbert (2014), define developing a hunch as a vital phase in their Spiral of Inquiry framework
Without evidence to back them up, hunches remain subjective. The well-planned use of data in an inquiry can turn a hunch into a credible, evidence-based hypothesis and call-to-action.
Use data to:
- confirm hunches
- reveal new patterns of insight
- justify change
- motivate colleagues, stakeholders, and school leaders into taking action.
Key resource
A framework for transforming learning in schools: Innovation and the spiral of inquiry
Helen Timperley, Linda Kaser, and Judy Halbert outline their model for teacher inquiry.
More information »
- Primary school teachers use maths assessment to increase student – Roydvale and Wairakei primary schools inquired into ways of helping students gain ownership over their learning.
- Teacher inquiry – Information on the purpose of teacher inquiry, a schoolwide approach, inquiry frameworks, and school examples of inquiry.
Using data to support teacher inquiry – An example
Inquiry scenario
High School science teachers inquire into improving outcomes for at-risk students by introducing flipped learning.
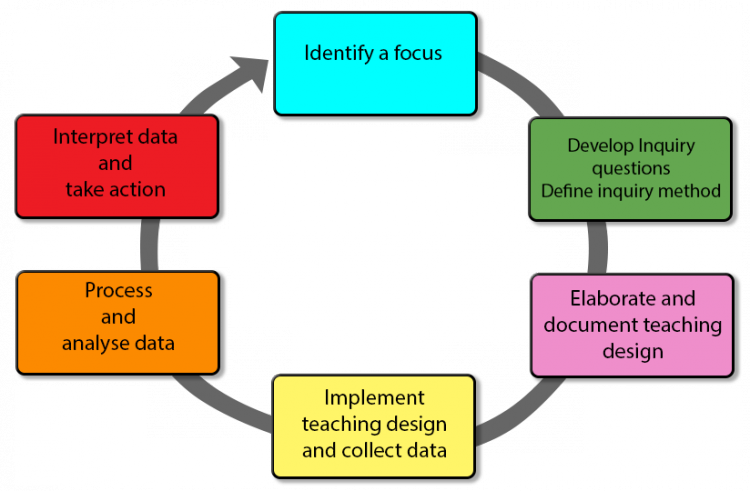
| Teacher inquiry cycle steps | Actions taken |
| 1. Scanning – What's going on for learners? | Achievement data reveals that at-risk students are unable to demonstrate progress in understanding of key indicators. Submission rates of assignments and homework tasks are low. Teacher observations describe some students as presenting signs of disengagement from classroom learning. |
| 2. Focusing – Where will concentrating our energies make the most difference? | Teachers collect student feedback through a questionnaire. They gather qualitative feedback from students regarding likes and dislikes of classroom and assignment/homework tasks. Teachers analyse the data. Qualitative feedback shows that students are:
|
|
3. Developing a hunch – How are we contributing to the situation? | Teachers reflect on how they might be contributing to the situation. They wonder whether there might be too much teacher-talk or lecture-style presentation of key concepts in the classroom. |
| 4. New learning – How and where will we learn more about what we do? | Teachers collaborate and consult experts within the school or Community of Learning | Kāhui Ako. They consider best-practice pedagogy and research on student engagement and motivation. They find flipped learning:
|
| 5. Taking action – What can we do differently to make enough of a difference? | Teachers introduce a flipped learning component to the next assignment. The component contains:
Teachers use analytics in Moodle to monitor how many times students have accessed the flipped learning material. Teachers use the analytics embedded in the forum tool to monitor how many times a student has posted or replied to a classmate's post. |
| 6. Checking – Have we made enough of a difference? | Teachers collect and represent all data using appropriate visualisation tools. They consult data to analyse whether their flipped learning intervention has improved outcomes. They:
Teachers then share and report on data with colleagues, and students where appropriate. Teachers use data to justify changes going forward. |
More examples »
- Primary school teachers use maths assessment to increase student – Roydvale and Wairakei primary schools inquired into ways of helping students gain ownership over their learning.
- Teacher inquiry: Snapshots of learning – Classroom-based examples describing how educators intentionally pair digital technologies with inclusive pedagogy to improve learning outcomes for students.
Learning analytics are defined as “the measurement, collection, analysis and reporting of data about learners and their contexts, for purposes of understanding and optimising learning and the environments in which it occurs.”
Learning analytics: drivers, developments, and challenges (Ferguson, 2012).
Many virtual platforms such as Moodle and Google classroom have built-in analytics which provide teachers with information about the digital learning activities of their students. By following students' digital actions in online learning spaces, teachers can access data to inform next steps.
Learning analytics harnesses the potential of digital learning, enabling teachers to:
- provide increasingly personalised, meaningful, engaging learning experiences for students
- track student progress
- get early intervention information as soon as possible
- make informed decisions about strategies that are most likely to make a difference for students.
More information »
- Ten trends 2014: Learning Analytics – An explanation of why learning analytics holds important implications for teaching and learning from CORE Education.
How learning analytics can support teacher inquiry
Teacher inquiry is an effective method to help teachers gain a better understanding of their classroom practice. By developing reflective practitioner competencies, it contributes to teachers' self-evaluation and improvement. Emerging teaching and learning analytics technologies are at the spotlight of the research and practice communities, globally to facilitate this process.
Demetrios G.Sampson - Teaching And Learning Analytics To Support Teacher Inquiry
Learning analytics and the collection of student data can play a critical role in supporting the various steps of the teacher inquiry cycle
Digital Tools to support learning analytics
Tools to identify patterns within student data
- Learning analytics enriched rubric – An enriched rubric containing some criteria and related grading levels that are associated to data from the analysis of learners’ interaction and learning behaviour in a Moodle course, such as number of post messages, times of accessing learning material, and assignment marks.
- Level up! – A Moodle plugin that gamifies learning by converting student progress data into experience points.
- Forum graph – Moodle plugin that visualises interactions between students on chat forums. Reveals information such as which students are leading discussions and which students, in particular, are in dialogue with each other.
- Moodle learning analytics – A video explaining the learning analytics capabilities embedded in Moodle.
A chat forum analytics tool for Sakai. Provides heat maps describing the interactivity of students on chat forums and social networks.
Tools to predict future trends in students’ progress
This plugin for Moodle measures student engagement and identifies at–risk students.
Tools that inform and recommend teaching and learning actions
An adaptive learning platform that gauges what students already know and recommends pathways for learning. Teachers can draw on Knewton's open-source course content to set assignments and track student progress. Use inbuilt analytics to get a fuller picture of students' learning contexts.
- Knewton adaptive learning platform tutorial – A video.
Outcomes of learning analytics
| Learning analytics outcome | Description |
| Discover patterns within student data | Helps teachers provide more informed support and scaffolding to individual students and conduct more holistic assessments. |
| Predict future trends in students’ progress | Elicits how the students might perform in the future, for example in terms of performance or engagement, and plan appropriate support. |
| Recommend teaching and learning actions | Recommendations may refer to educational resources/tools or learning/assessment activities that are appropriate to meet the individual needs of students. The recommendations may be addressed to either teachers or students. |
Table source: Demetrios G. Sampson - Learning Analytics: Analyze Your Lesson To Discover More About Your Students
Key resources
Using data to improve learning: A practical guide for busy teachers
A clear, step-by-step approach to using data for improving learning by Anthony Shaddock.
A framework for transforming learning in schools: Innovation and the spiral of inquiry
Helen Timperley, Linda Kaser, and Judy Halbert outline their model for teacher inquiry.
A US resource on data policy and use in education.
Information for NZ school leaders and teachers about gathering, analysing, interpreting, and using information about students' progress and achievement.
Readings
Learning analytics: drivers, developments and challenges (Ferguson, 2012).
A review of learning analytics, beginning with an examination of the technological, educational, and political factors that have driven the development of analytics in educational settings.
Informing pedagogical action: Aligning learning analytics with learning design (PDF) (Lockyer, Heathcote & Dawson, 2013).
How learning analytics can inform pedagogical action.
Informing learning design to improve teacher inquiry (Pozzi, 2014).
An overview of current research into the connections between learning design and learning analytics.
Learning analytics tools
Discovering patterns within student data
Learning analytics enriched rubric
An enriched rubric containing some criteria and related assessment levels that are associated with data from the analysis of learners’ interaction and learning behaviour in a Moodle course, such as number of post messages, times of accessing learning material, and assignments.
A plugin that gamifies learning by converting student progress data into experience points.
A plugin that visualises interactions between students on chat forums. It reveals information such as which students are leading discussions and which students are in dialogue with each other.
A chat forum analytics tool. Provides heat maps describing the interactivity of students on chat forums and social networks.
Predicting future trends in students’ progress
This plugin measures student engagement and identifies at-risk students.
Recommending teaching and learning actions
An adaptive learning platform that gauges what students already know and recommends pathways for learning. Teachers can draw on the open-source course content to set assignments and track student progress. The in-built analytics give a fuller picture of students' learning contexts.
Helps parents and teachers monitor student progress. It also provides recommendations for future actions.
Data visualisation tools
A design app for making infographics. It has tools for visualising data in stylish charts and graphs. It has both free and premium accounts.
A graphic design app with an infographic maker.
Software for analysing and visualising data. Free to download and use, with a premium account for added features.
Software for analysing qualitative data.
This section on Assessment Online explains different types of graphs and their uses.
The 38 best data visualisation tools
Explanations of and, links to, data visualisation tools on Creative Bloq's blog.


